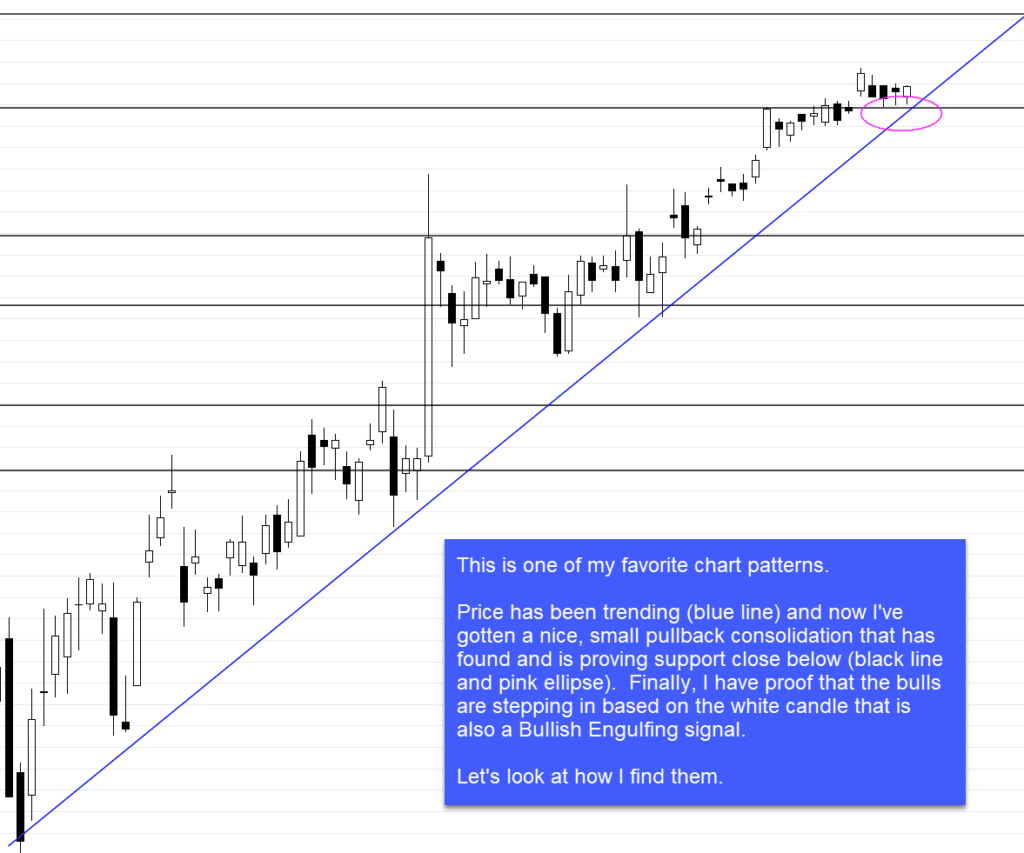
Welcome to the first issue of the Live Trading Alerts Newsletter. In this issue, I will be covering one of my favorite Alert Window configurations.
No Cross + 3×8 Trap + V-Stop + White Candle
The first thing I noticed is that these small “rest” pullbacks are often defined by price pulling back between a rising 8ema of closes (black line) and the 3ema of highs (pink line). So, I can use that to identify those setups.
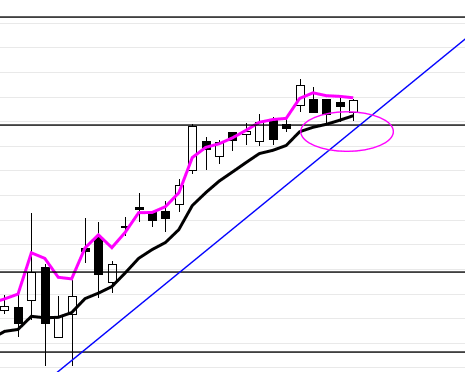
However, I only want to be alerted to these pullbacks when they happen in an uptrend. So, the first thing I add to my Alert Window Configuration is the condition “No Recent Avg Cross,” where I specify that the 3ema of Highs has not crossed the 8ema of closes for at least 15 candles. Since I trade Daily charts, I know there has been no significant change in the uptrend for at least 3 weeks.

Now I want to find those pullbacks. So, I add the scan “User-Defined Trap This Candle” to my Alert Window configuration. (Notice that I changed the default parameter from “3ema of Closes to 3ema of Highs.)

The next thing I want is to make sure the pullbacks I find are not far from support (which would give me too much risk, because I want to put my stop far enough below to give the trade room to work, but still close enough below that the loss would be acceptable). I do this by adding the “Bull V-Stop Within X% Below” scan to my configuration and then setting the “How Close to V-Stop” parameter to a maximum acceptable value. I like 3.5%. (Note that I use a 10-candle, 1.5 ATR V-Stop.)

The final thing I want to look for is that the bulls are stepping in. There are many ways I could identify these in LTA. However, rather than be too specific (too tight in the scan), I want to cast a little broader net. To do this, I’ll just look for a white candle, planning to use my eye to evaluate the chart before deciding whether to take a trade.

Even casting that broader net, you’ll notice that at this point in time only 6 tickers pass all 4 of my scans. So, I want to consider whether I’m using a “broad enough” universe. In this case, I have been using the S&P500 Components to run my scans against.
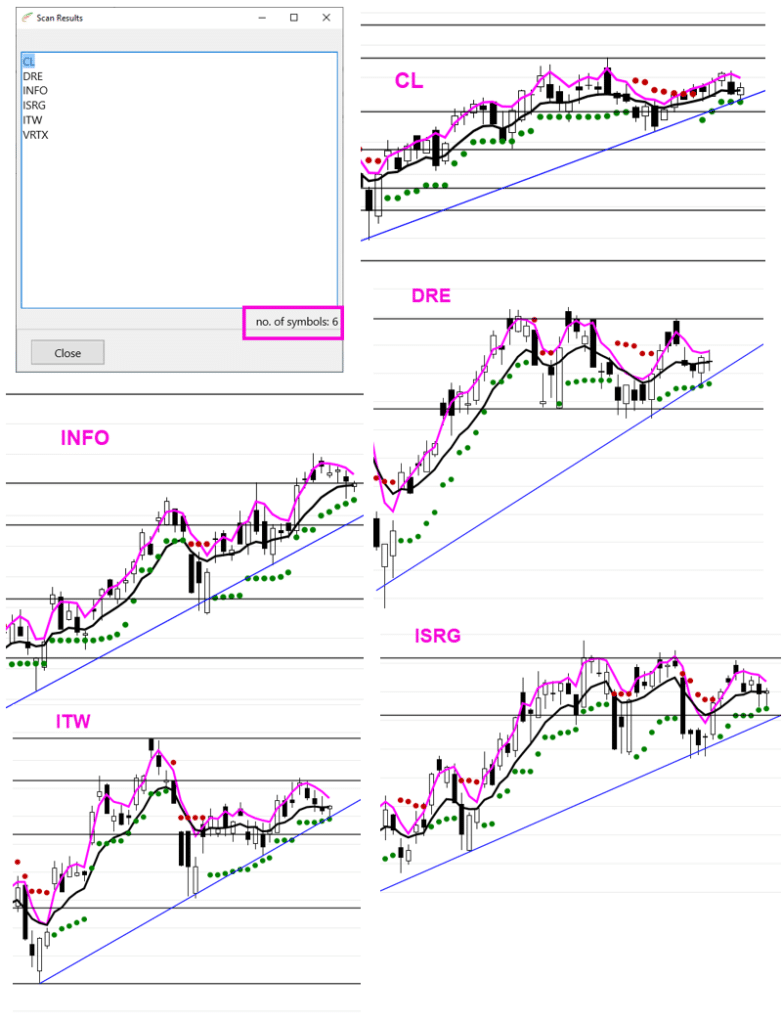
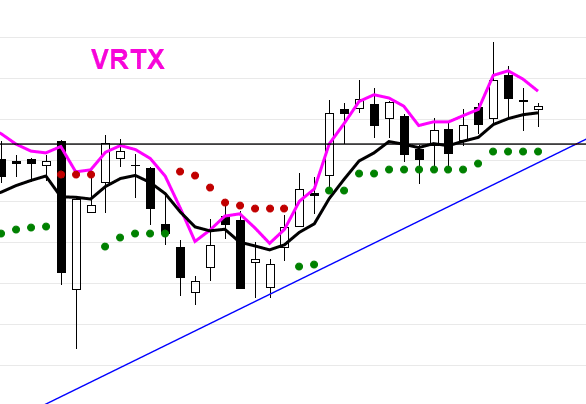
Not perfect, but pretty much in the ballpark. So, rather than tighten down parameters, I’m just going to widen the universe to cast a wider net. You may do it differently, but that is my approach. However, if I broaden the net wider (like to look at all the Russell 1000 tickers), I need to make sure I have liquidity. So, I’ll add an Average Volume scan and a Stock Price Range scan.
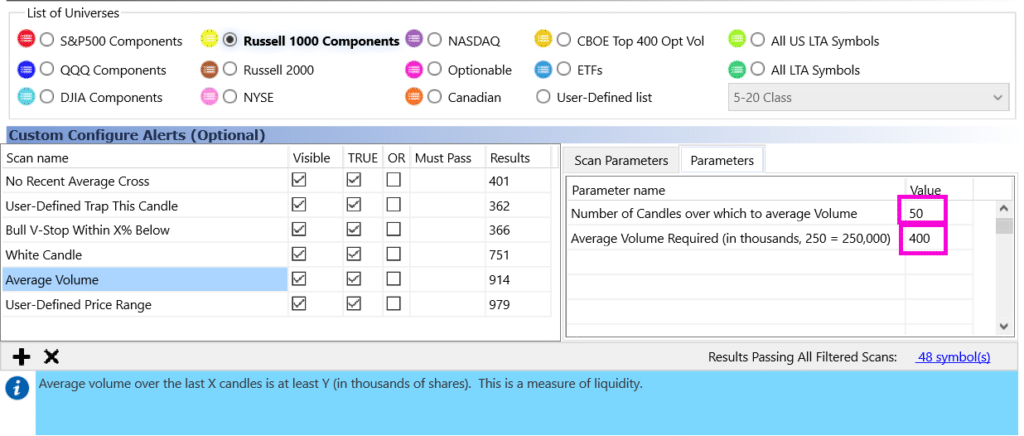

In this case, I’m limiting my results to only tickers that average 400,000 shares traded per day on a 50-day average basis. I’m also setting a minimum acceptable price to be $5. This means that any scan result or alert I get will trade at least $2,000,000 worth of stock per day. This ought to make it easy for me to get in and out of any trade. In this case, the broader net still finds 48 tickers passing all the scans.
If that’s not enough, I can go even wider to “All US LTA Symbols,” which gives me 121 hits.
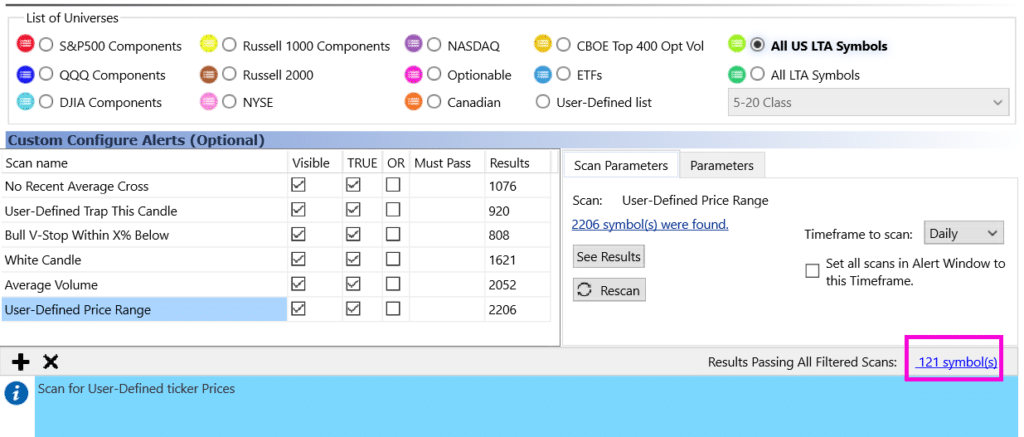
That finds the setups I want…and plenty of them. However, I’m not interested in flipping through 121 or even 48 charts all day hoping to find them at exactly the right time. So, the question now becomes “when do I want to be alerted to these setups?”
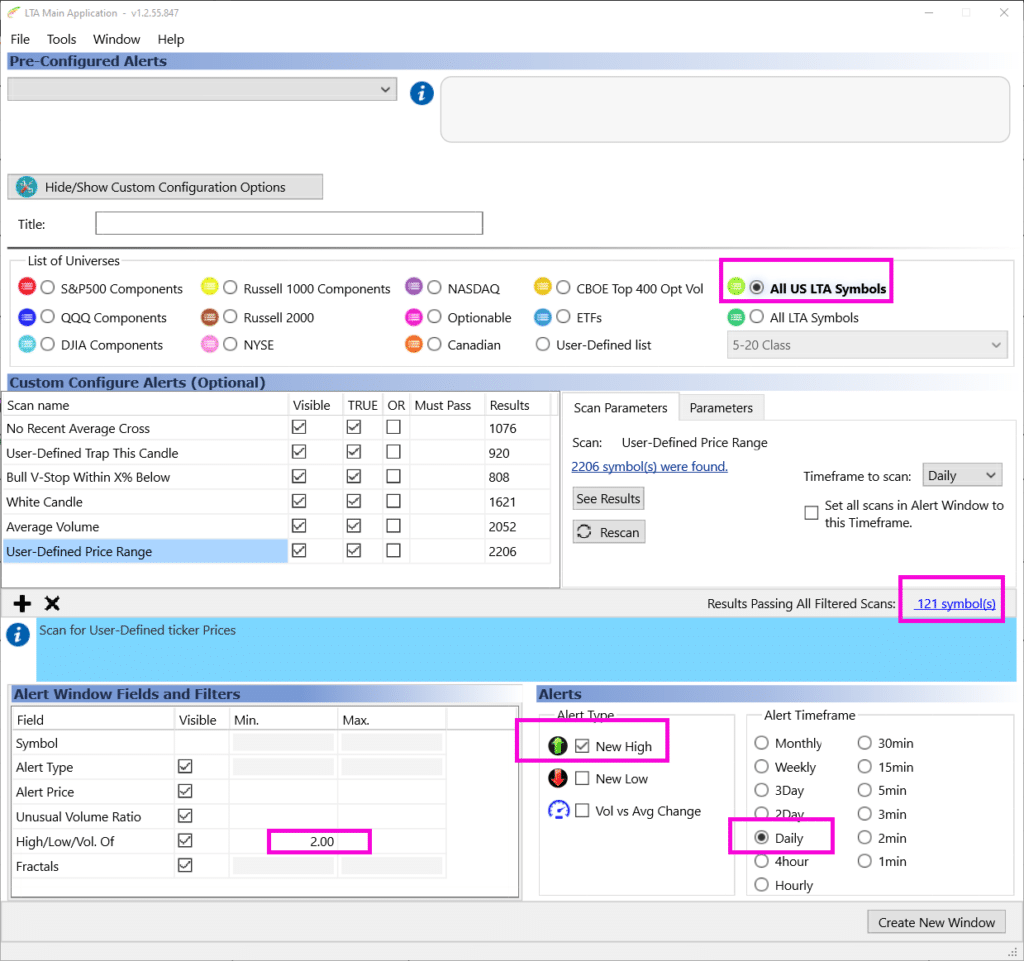
Once again, there are many different points in price action that can be alerted. One is not better than the other…the one that is best for you will depend entirely on your trading personality. In my case, I want to be alerted to a new daily high. However, even that is not enough proof that the bulls have stepped in for me. So, I’m also going to set an Alert Filter of “High/Low/Vol Of” of 2. This will make sure the 48 (or 121) tickers only alert me when they are making a 2-candle high.
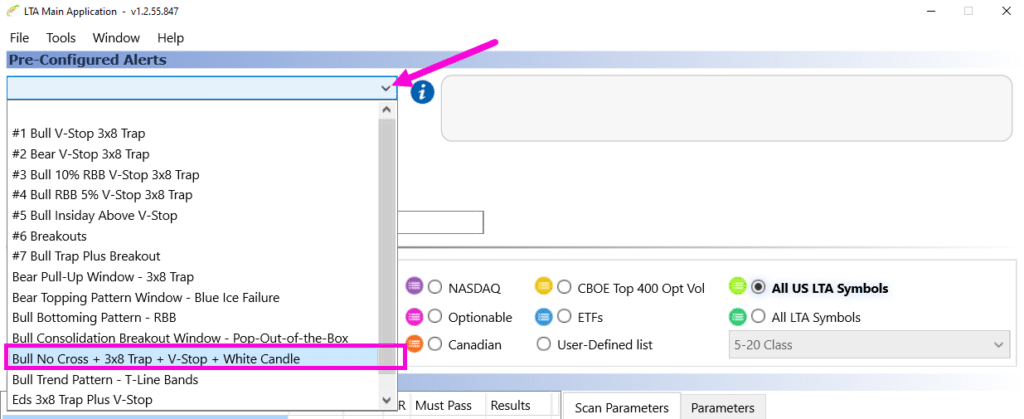
If you like this Alert Configuration, now you know how and why I would build it this way. However, you can set it up much more easily. I have saved the configuration in the Pre-Configured Alerts list so that you can set it up with a couple clicks.

Recent Comments